| Inscrits: | 658 | ||||||
| Votants: | 449 | ||||||
| Exprimés: | 439 | ||||||
| Nuls et blancs: | 10 | ||||||
| Résultats à Najac | Total circonscription
n°2 |
||||||
| Classement des candidats par suffrages (Najac) | Voix | % expr | Voix | % expr | |||
| 1 | Philippe MOLINIE | 2 | 0,46% | 212 | 0,47% | ||
| 2 | Marie-Lou MARCEL | 161 | 36,67% | 22441 | 49,65% | ||
| 3 | Philippe BRAMM | 20 | 4,56% | 3480 | 7,70% | ||
| 4 | Jean-Louis CALMETTES | 48 | 10,93% | 1661 | 3,68% | ||
| 5 | Laurent TRANIER | 161 | 36,67% | 12416 | 27,47% | ||
| 6 | Christophe POURCEL | 17 | 3,87% | 1654 | 3,66% | ||
| 7 | Yann PUECH | 7 | 1,59% | 428 | 0,95% | ||
| 8 | Aline LOUANGVANNASY | 23 | 5,24% | 2904 | 6,43% | ||
| TOTAL | 439 | 100,00% | 45196 | 100,00% | |||
Auteur/autrice
magali.bru@eelv.fr
Publications similaires

Une nouvelle association en création: l’UCA Najac
A l’initiative de quelques Commerçants et Artisans de Najac qui sont : Corinne SIMON « Hotel-Restaurant Oustal del Barry », Sylvie SALLET « Atelier poterie », Marie-Agnès LEMOUZY« L’épicerie du Coin… »,...
Lire la suiteCommuniqué de la commission « Accueil »
Lors de la dernière réunion du conseil municipal, il a été voté la création d’une commission concernant l’accueil des habitants de Najac...
Lire la suiteConseil municipal du 14 janvier 2013 – Ordre du jour
Le prochain conseil municipal aura lieu ce lundi 14 janvier 2013, dans les locaux habituels de la Mairie à 20h. Ordre du...
Lire la suiteQuestions en eaux troubles…
Une idée communément admise veut que la qualité de l’eau soit meilleure à Najac que partout ailleurs… Il se pourrait que les...
Lire la suite
Terre Paysanne: premier pressage de la saison à la Ferme du Marigot
L’association Terre Paysanne organise une première pressée le vendredi 14 septembre, à la ferme du Marigot (La Fouillade). Pensez à le faire savoir...
Lire la suite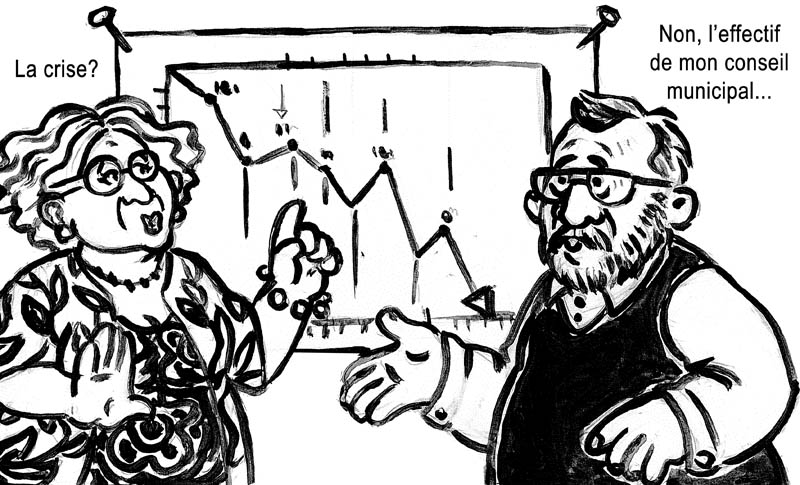
{Najac} Démissions au conseil municipal: 1 partout!
Coup de théâtre à la fin du conseil municipal najacois qui s’est tenu lundi 3 septembre: après avoir assisté à la séance,...
Lire la suite